Dashboard
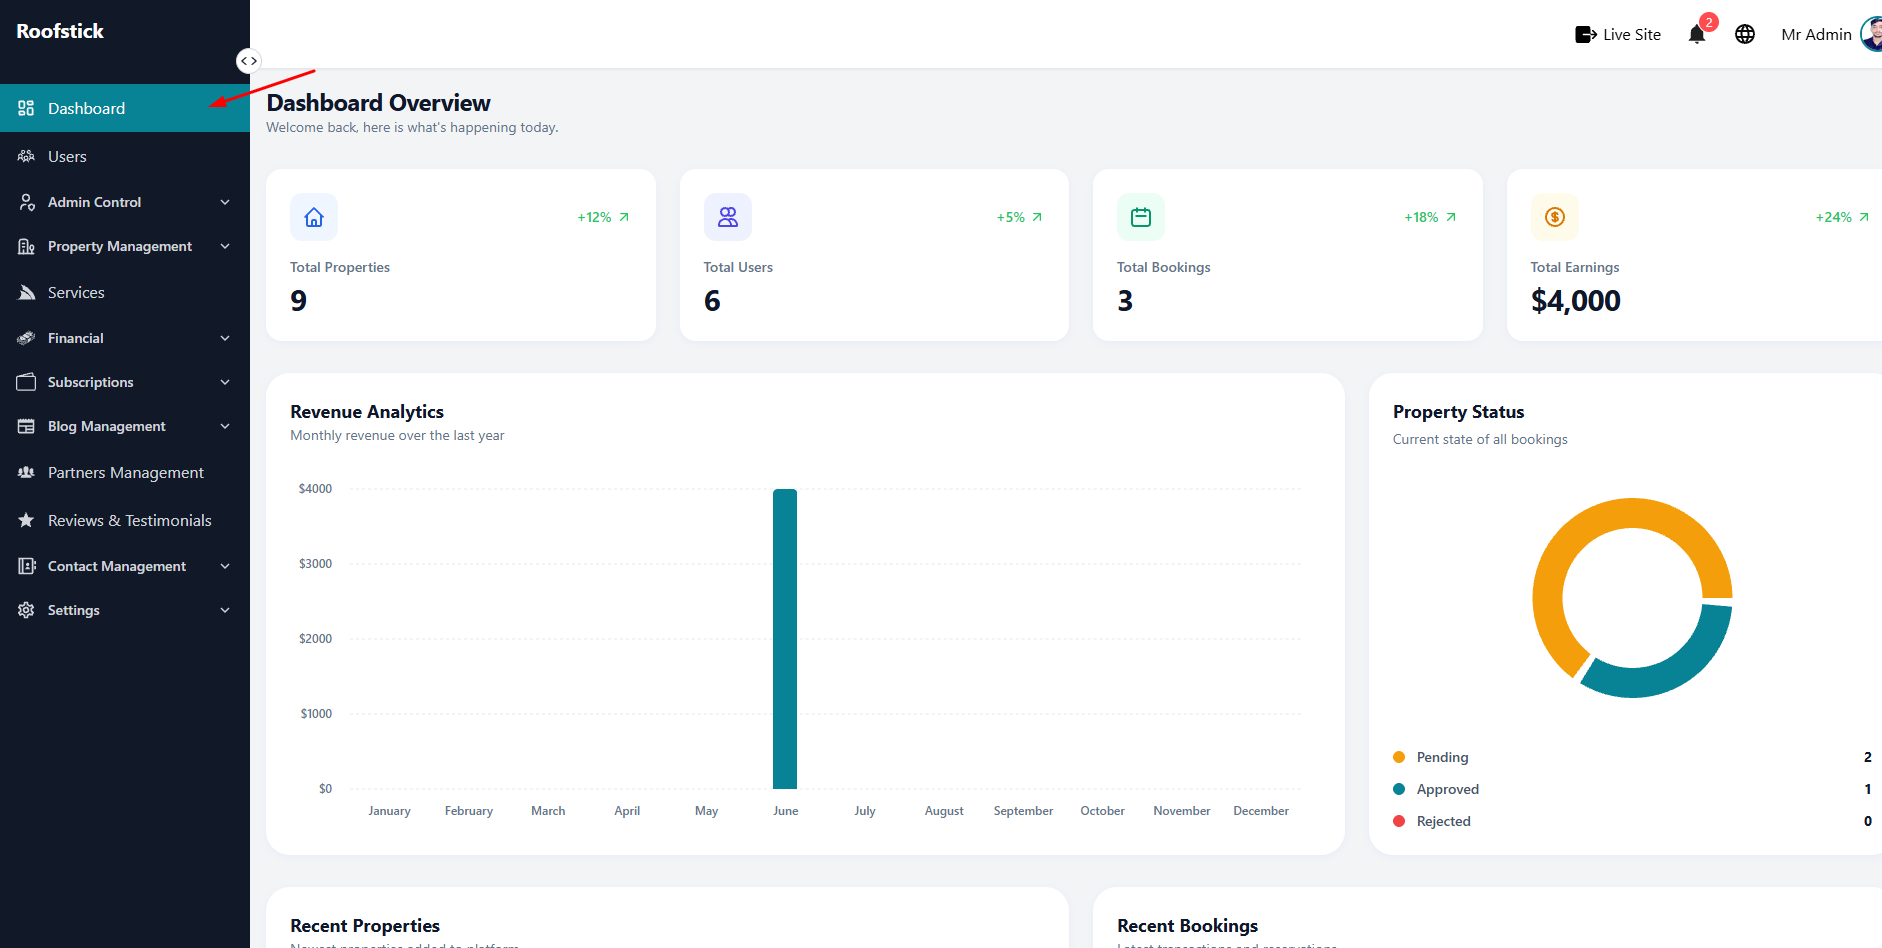
The Dashboard is the main control center for the admin. It provides a quick, bird's-eye view of the entire platform's activity through various data counters and statistics.
Here is a detailed breakdown of what each section on the dashboard indicates:
Overview Counters
- Total Property: Shows the total number of properties uploaded to the platform, regardless of their status. This helps the admin track the overall growth of listings.
- Total Approved Property: Displays the number of properties that have been reviewed and approved by the admin. These properties are currently live and visible to users.
- Total Pending Property: Indicates the number of properties submitted by agents that are waiting for admin review. The admin needs to check these to approve or reject them.
- Total Rejected Property: Shows the number of properties that did not meet the platform's guidelines and were rejected by the admin.
- Total Users: Displays the total count of normal users (property seekers/buyers) registered on the platform.
- Total Agents: Displays the total count of registered agents who can list properties for rent or sale.
Charts & Analytics
Below the overview counters, the dashboard provides visual representations of your platform's performance through interactive charts.
1. Revenue Analytics
This chart displays a visual timeline of the platform's financial earnings. By reviewing this graph, the admin can easily track income trends over time, helping to understand business growth and identify peak earning periods.
2. Property Stats Chart
This visual chart breaks down the status of all properties on the platform. It provides a quick, comparative view between Approved, Pending, and Rejected properties, allowing the admin to understand the overall distribution of property listings at a single glance.